
There are four main types of market analysis:
– Fundamental Analysis
– Technical Analysis
– Sentiment Analysis
– Statistical Analysis
There exists a continuous debate as to which is better, but it is best to have an understanding of all.
Fundamental Analysis
Fundamental analysis involves making trade decisions based on global news and economic data reports. It involves analysing all the factors that affect the demand and supply for currencies in the exchange. This entails taking into consideration various economic, social, and political forces that may affect currency prices.
The idea behind this type of analysis is that if a country’s current or future economic outlook is good, its currency should strengthen and if outlook is unfavourable, the currency should weaken.
When talking about fundamental analysis, we are looking at micro and macro-economic factors that determine the short-term and long-term value of a currency. Here we are looking at:-
- Overall market sentiment – How does the economic health of a particular country or region look like? And how do people perceive it? Positively? Negatively? Is it improving or worsening?
- News reports – Has any positive news come up that may affect the state of an economy? Has a region just come out of a recession or has it been warned by the threat of war by one of its largest adversaries?
- Economic data – How does the following economic data of a country look like? – GDP numbers, inflation numbers, weekly unemployment claims, retail sales, consumer confidence data, etc… Are these numbers improving or worsening?
- Central Banks’ stance – Is the US Federal Reserve taking hawkish (aggressive) or dovish (conservative) measures in response to the latest inflation numbers coming out? How will an increase or decrease in interest rates affect the demand and supply of the dollar? Shall the European Central Bank apply quantitative easing or quantitative tightening in order to increase or reduce the amount of euros in circulation?
- Government monetary and fiscal policy – What decisions taken by individual governments will affect their overall economy? Has a government just announced a less than favourable budget for the next fiscal year? Has a government announced tax cuts to households earning the least amount of money in its region? Is the government increasing its efforts to aid local Small and Medium Enterprises by providing more investment aid or subsidies? What would be the reaction of the nationals living in the region to such decisions?
- Credit ratings – Has a country’s credit rating been upgraded –making it a safer bet to repay its ongoing debts? How will markets react to such news? How would a downgrade affect the demand for a currency?

These are all just a few of the fundamental factors that one may assess when analysing the attractiveness of a particular currency.
The better shape a country’s economy is in, the more foreign businesses and investors will invest in that country and that will result in the need to purchase that country’s currency to obtain those assets (and vice versa).
In simple practical terms, for example, an individual may decide to go long on Japanese yen against the British pound based on the belief that Japanese economic situation will outperform that of Great Britain and therefore the yen should have a larger value. For example, Germany, one of the largest players in the European Union, may have just posted an increase in unemployment for the third month in a row, whereas the US unemployment rate has been stable for quite some time. This may prompt an individual to short the euro against the dollar with the view that the European economy is lagging its American counterpart.
Technical Analysis
Technical analysis differs from fundamental analysis because it only takes into account the price and volume of an asset. Here, the main assumption is that all known fundamentals are already factored into the price and the charts, and therefore there is little need to pay close attention to them.
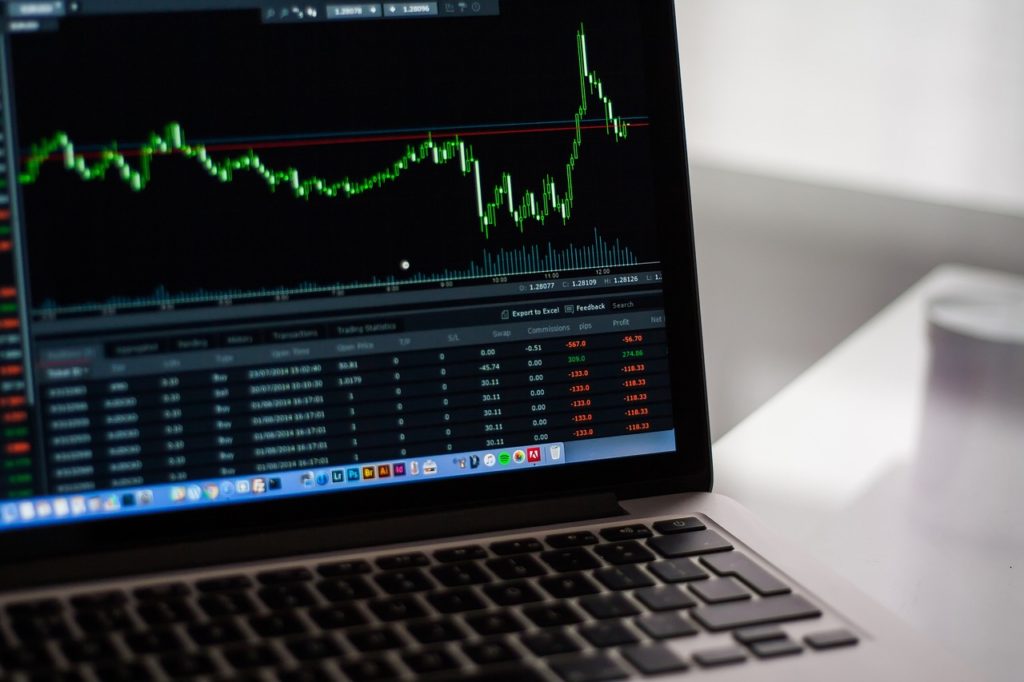
Technical analysts firmly believe in the notion that history tends to repeat itself. One of the first things that comes to mind when someone mentions the word “technical analysis” is a chart and technical analysts (sometimes referred to as chartists) use charts because they are the easiest way to visualise historical data.
Technical analysts look for similar trends and patterns that have formed in the past and will form trade ideas based on the assumption that price could possibly act the same way it did before.
Technical analysis may also include the use of indicators that give signals based on previous price behavior. Such signals may be used to trigger trade entries, exits or both.
When talking technical analysis, we often hear terms such as support and resistance levels, moving averages, trend lines indicating the direction of a trend, pivot points, RSI indicators showing overbought and oversold levels, Fibonacci levels, Bollinger bands, MACD lines… These are but a few of the technical analysis tools and indicators one may use. The list is virtually endless.

Although technical analysis is very subjective and some price levels may seem quite different from trader to trader, certain price patterns and indicator signals tend to become self-fulfilling. As more and more forex traders look for certain price levels and chart patterns, the more likely that these patterns will manifest themselves in the markets.
Sentiment Analysis
The market basically represents what all traders feel about the market and sentiment analysis is used to gauge how other traders in the market feel. Each trader has his/her own personal opinion of why the market is acting the way it is and whether to trade in the same direction of the market or against it.
Sentiment analysis involves evaluating whether current or long-term overall market sentiment is bullish or bearish. Is the outlook for a particular market or currency looking positive and do you think it will rise (bullish outlook) or do you have a pessimistic view and think that other players in the market will sell and push the price downwards (bearish outlook)? Taking all of this into consideration is a part of sentiment analysis.
Sentiment analysis is in itself often a contrarian indicator. If you take into consideration that the majority of forex traders are unprofitable, that means that the majority of them are making wrong decisions (not necessarily the case, as they may make the right guess on the direction of where the market is heading but get the timing wrong or take profits too soon and let losers run). In this view, some believe that by gathering the opinions and assessing the trades of most retail traders, it would be a good idea to take the opposite trades as these traders are more likely to get it wrong. So if the majority of retail traders are shorting the dollar, whereas some traders will continue to sell the dollar in order to take advantage of the current trend, others will look to find buying opportunities with the belief that the majority of retail traders are incorrect and sentiment will likely change.
Statistical Analysis
This type of analysis is often ignored and is not usually mentioned in most textbook definitions of market analysis. However, it is still a very important method to develop insights about the market by studying past data and the statistical probability of an event occurring vis-à-vis similar cases in the past.
Statistical analysis works hand in hand with technical analysis. Here, traders use statistics of previous market behavior to develop strategies that require very low human interaction (example: previous high-close data, closing gaps, day or seasonal price statistics, etc…). This type of analysis removes a lot of emotion from trading but often needs a lot of back-testing.
As is often said, previous performance is not a guarantee of future results. Since such analysis is heavily based on past data, there is never any certainty that past data will work in the future.
Which Type of Analysis is best for Forex Trading?
Simple answer – A mix of all.
It is wise not to be a one-sided extremist. One method is not necessarily better than the other and it is up to the individual trader to make optimum use of the type of trading that resonates best to him/herself.
In reality, the different types of market analysis often complement each other. Even hardcore technical traders may find useful fundamental information that can help with their technical analysis. And fundamental traders may make use of technical indicators in order to time entries or exits according to the charts.
Let us take a practical example of why it is important to have an open minded view regarding such matters.
Let us say that you’re looking at your GBP/USD charts and you find a good trading opportunity to enter the market. Your moving averages are lining up, a parallel price channel is developing nicely and you decide to take the trade. You are completely unaware or indifferent to the fact that a US Federal Reserve meeting is about to take place in a few hours and there is the possibility of an announcement of an interest rate hike or decrease which will inevitably have an effect on the success or failure of your open trade. Such an announcement will most likely have an effect on overall market sentiment and it would be wise to know the (approximate) statistical probability of the currency price falling or rising with respect to an increase or decrease in interest rates.
This is why there is no one way to trade that is better than another and that it is often recommended not to rely solely on one method or another but to take a more holistic view of the market. By balancing the use of all the above mentioned types of market analysis, one can really get the most out of your trading.