The Fibonacci sequence and Fibonacci ratio have been discovered and rediscovered in various forms – not only in mathematics, but also across various aspects in our everyday lives – including geometry, architecture, fine art, biology, and throughout the natural world.
- If you count the petals in a flower, you would most likely notice that the number of petals is either 3, 5, 8, 13 or 21. These are all Fibonacci numbers.
- If you cut a banana into slices, you’ll notice it has 3 distinctive sections and an apple has 5.
- We have two hands – both of which have 5 fingers and each finger is divided into 3 parts. Again, all these numbers are Fibonacci numbers.
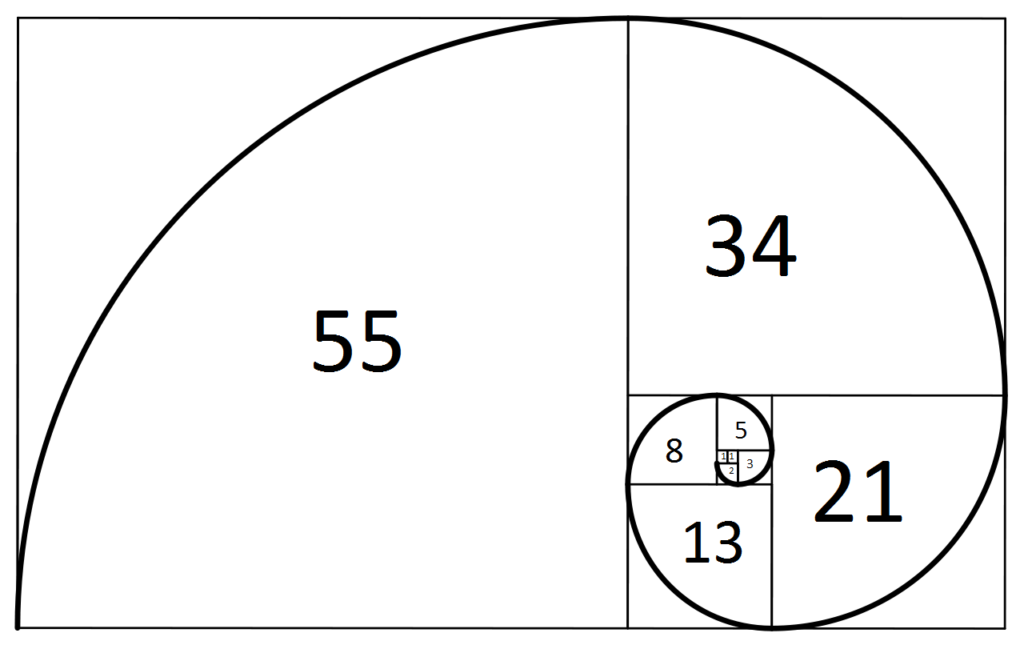
- In geometry, when the Fibonacci ratio – also known as the Golden Ratio – is applied as a growth factor, you get a special kind of spiral known as the Golden Spiral. One can find countless examples of the Golden Ratio and Golden Spiral in countless places everywhere every day – seashells, ocean waves, hurricanes, flower buds, spider webs, inside of the human ear… The list goes on.
- Many artists use the Golden Ratio or spiral in their creative works. Legendary painter Leonardo da Vinci used the ratio in his Mona Lisa masterpiece. It was also famously used in Salvador Dali’s painting of ‘The Sacrament of the Last Supper’.
The Golden Ratio can be seen everywhere. This is often why it is commonly also known as the divine proportion. It is even naturally occurring in the spiral galaxies of outer space.
To understand this better, it would be wise to take a brief glimpse of its history.
The Fibonacci sequence was named after Italian mathematician Leonardo Pisano Bigollo, more commonly known as Leonardo Fibonacci. The sequence was originally developed and used by Indian mathematicians some time between 450 and 200 BC. However, it was Fibonacci who introduced these numbers to Western Europe after learning about the Hindu–Arabic numeral system from Indian merchants during his travels.
After 0 and 1, in the Fibonacci sequence of numbers, each number is the sum of the two previous numbers:
- 0, 1, 1, 2, 3, 5, 8, 13, 21, 34, 55, 89, 144, 233, 377, 610, 987… continuing to infinity.
Each number is approximately 1.618 times larger than the previous number. This value – 1.618 – is called Phi.
Using Fibonacci to Aid Trading
Advocates of Fibonacci believe there exists a relationship between Fibonacci numbers and the prices of any asset since these numbers are continuously seen in various aspects of the universe.
It is a known fact that the prices of a currency, asset or commodity do not move in a straight line and every time there is a huge move, this is usually followed by some sort of pullback or retracement. The Fibonacci retracement tool will help us in finding potential areas where price may find support during a pullback after a large move on the upside or downside.
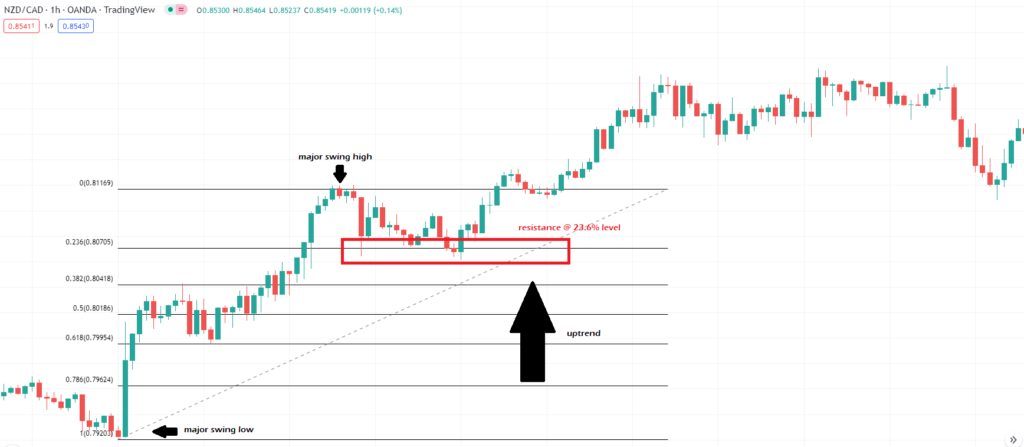
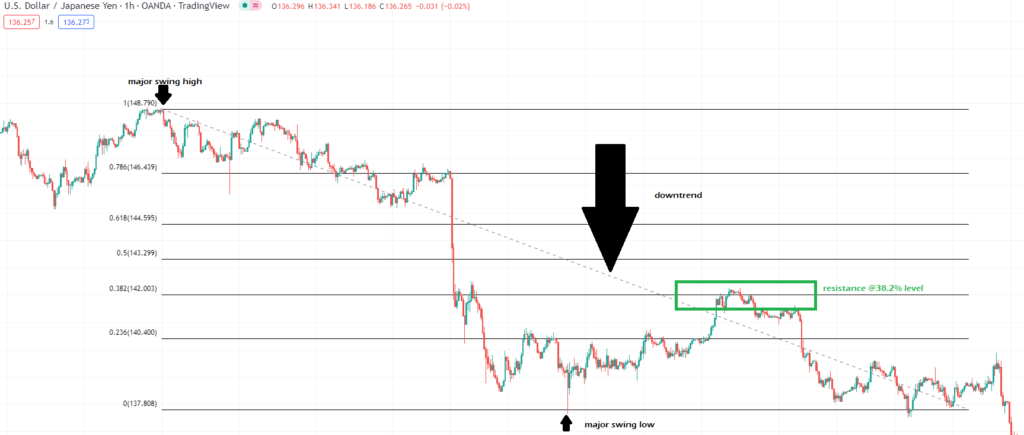
When price is in an uptrend and makes a significant move upwards, the Fibonacci retracement tool can help to find potential areas where price may find support during this period of pullback before continuing its move upwards. Alternatively, the retracement tool can help to find potential areas where price may find some resistance during a downtrend before continuing its downward move.
In a trend following strategy, Fibonacci retracement levels are depicted by taking highs and lows on a chart and marking the key Fibonacci ratios – 23.6%, 38.2%, 61.8% and 78.6% – horizontally to produce a grid. While not officially a Fibonacci ratio, 50% is also commonly used. These lines are used to identify possible price reversal points.
Respecting the stated Fibonacci number string (0, 1, 1, 2, 3, 5, 8, 13, etc…), the Fibonacci retracement levels are all derived from this number string. After the sequence gets going, dividing one number by the next number yields roughly 0.618, or 61.8%. Dividing a number by the second number to its right, the result will be approximately 0.382 or 38.2%.
(Ex: 5,8,13. (5/8) = 0.625, (5/13) = 0.384)
Suppose the price of a currency pair goes up by 10 pips and then drops by 23 pips. Here, it has retracted by 23% and 23.6 is a Fibonacci number and many traders believe that this level should hold a significant relevance in the market since Fibonacci numbers are found all throughout nature.
The Fibonacci retracement tool is available in all major charting software.
Fibonacci retracements can be used to place entries and determine price targets and stop-loss levels. Unlike moving averages, Fibonacci retracement levels are static and this allows for relatively easy identification which helps traders to anticipate and react accordingly when certain price levels are tested.
Whereas Fibonacci retracement levels can be used to predict potential areas of support and resistance, Fibonacci extensions can assist traders by providing Fibonacci-based profit targets for their trades in the direction of the trend. Similar to the retracement levels, the key Fibonacci extension levels are: 38.2%, 50.0%, 61.8%, as well as the 100%, 138.2%, 161.8%, 261.8% and 423.6%.
It is vital to keep in mind that Fibonacci numbers and levels do not provide a magic formula for traders, and therefore it is advised not to use such levels solely as the basis of one’s trading decisions. There is no guarantee that price will reach or reverse at a particular extension level. Even if it does, it is not evident before a trade is taken which Fibonacci level will be important. The price could move through many of the levels or not reach any at all.
It would therefore rather make more sense to use Fibonacci tools in conjunction with other technical signals or indicators that confirm one’s theory that a price is predicted to go up or down. For example, by establishing the direction of the long-term and short-term trend.
Whereas some traders are convinced that Fibonacci retracements can forecast about 70% of market movements, their harshest critics would believe that these are simply psychological levels and should not be considered as the basis of one’s trading decisions. But the reality is that since so many traders are watching the same levels and placing buy and sell orders on these same levels, the support and resistance levels tend to become a self-fulfilling prophecy.
The aim of this article is not to teach you how to use Fibonacci signals and which exact consecutive steps one should take. There’s enough information in books, on the web and hundreds of decent YouTube videos which one can use to help gather a more in-depth understanding of Fibonacci levels, entry points, exit points, etc… The objective here is to simply introduce you to the concept, a basic understanding of how it works, and to peak your interest on whether a naturally occurring phenomenon in everyday life and nature can possibly help you in your trading journey.